Diagnostic Settings
Diagnostic Settings
Overview
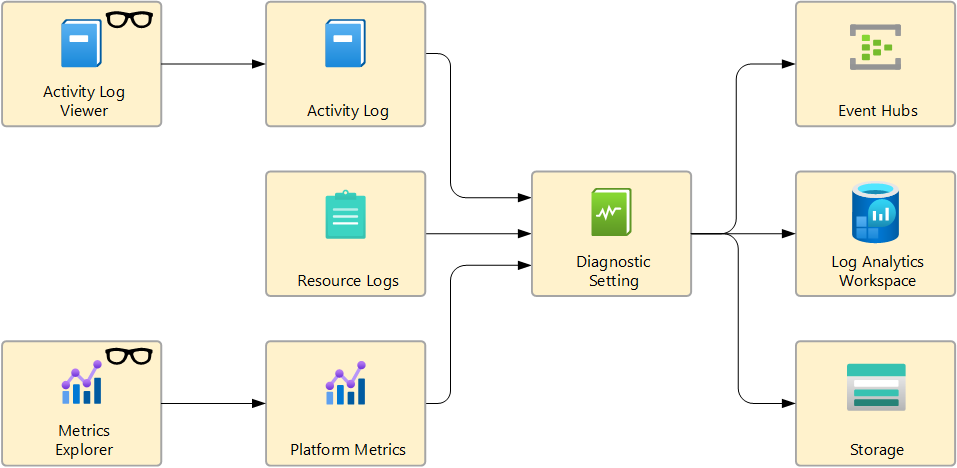
Diagnostic settings allow you to collect resource logs, platform metrics, and the activity log, sending this data to destinations such as Log Analytics, Storage Account, Event Hubs, or partner solutions. Each resource can have up to five settings, and each can send data to multiple destinations at once, but only one of each type (e.g., one Log Analytics workspace, one Storage account, one Event Hub, etc.).
These settings are essential for centralized monitoring, audit facilitation, and integration with external systems, supporting governance, compliance, and operational visibility in Azure environments.
Why use?
- Centralized monitoring: Consolidates logs and metrics from different resources for analysis, alerts, and auditing.
- Governance and compliance: Simplifies retention, backup, and log analysis for regulatory and security requirements.
- Integration: Enables sending data to external systems (SIEM, partners, etc.) via Event Hubs.
Supported destinations
- Log Analytics Workspace: Queries, workbooks, and alerts. Tables are created automatically when data is received.
- Storage Account: Storage for audit, static analysis, or backup. Supports indefinite retention and immutability policies.
- Event Hubs: Streaming to external systems. Requires specific permissions and configuration.
- Partner solutions: Specialized integrations with non-Microsoft monitoring platforms.
Restrictions and important points
- For Storage Account and Event Hubs, if the monitored resource is regional, the destination must be in the same region and cannot have network restrictions (VNet). You must enable the “Allow trusted Microsoft services to bypass this firewall” option so Azure Monitor can send data correctly.
- Each setting accepts only one destination of each type. For multiple destinations of the same type, create additional settings.
- The destination must exist before creating the setting.
- Storage Premium, DNS Zone endpoints (preview), and multi-dimensional metrics are not supported.
- You cannot filter granularly within a category; use transformations in Log Analytics to filter data.
- Be mindful of costs: collect only what is necessary, as data volume impacts pricing.
- After creating the setting, data may take up to 90 minutes to appear at the destination.
- Inactive resources may have delayed metric export to avoid unnecessary costs.
- Resource IDs with non-ASCII characters are not supported.
- When deleting a resource, remove Diagnostic Settings first. If the resource is recreated with the same name, old settings may be automatically reactivated, resulting in unexpected data collection and costs.
References
Official Diagnostic Settings documentation
Azure Monitor pricing
This post is licensed under CC BY 4.0 by the author.